Scenario/Summary
This week’s lab highlights the use of graphics, distributions, and tables to summarize and interpret data.
Follow the directions below to find one of the given academic articles from the Chamberlain library and then use that to describe the graphs and tables included. Further, you will describe other ways that the same data could be presented.
Deliverables
The deliverable is a Word document with your answers to the questions posed below based on the article you find.
Required Software
- Microsoft Word
- Internet access to read articles
Steps to Complete Week 3 Lab
PART 1:
Step 1: For our first broad-based search, choose one of the articles listed below that interests you. Use the underlined words in your chosen article to search and see how many articles from the Pro-Quest Nursing database contain these underlined words (see the example below the article list)
Article Titles (choose one!)
- Oral manifestations in diabetic patients under treatment for ischemic heart diseases: A comparative observational study
- Systolic blood pressure , diastolic blood pressure, and pulse pressure: An evaluation of their joint effect on mortality
- The Relationship Between Body Mass Index (BMI) and Menstrual Disorders at Different Ages of Menarche and Sex Hormones
- Adolescents’ first tobacco products: Associations with current multiple tobacco product use
- Association of lifestyle modification and pharmacological adherence on blood pressure control among patients with hypertension at Kenyatta National Hospital, Kenya: A cross-sectional study
- Demographic, parental, and personal factors and youth athletes’ concussion -related knowledge and beliefs
- Nutrition-related information-seeking behaviors of women trying to conceive and pregnant women: evidence for the life course perspective.
- Efficiency and optimal size of hospitals: Results of a systematic search
- Long working hours, sleep-related problems, and near-misses/injuries in industrial settings using a nationally representative sample of workers in Japan
- Demographic Characteristics of RN and Generic Students: Implications for Curriculum
- Clinical Characteristics of Diabetic Ketoacidosis in Children with Newly Diagnosed Type 1 Diabetes in Addis Ababa, Ethiopia: A Cross-Sectional Study
- Using Computerized Adaptive Testing to Reduce the Burden of Mental Health Assessment
Step 2: Go to the Chamberlain Library at https://library.chamberlain.edu (Links to an external site.)
Step 3: Click on the ProQuest Nursing link under the search box.
Step 4: Type the underlined words from the article that you chose into the first search bar. Checkmark Full Text, Peer Reviewed, and choose Last 12 Months from the drop down list. Last, choose English Language under the language section.
Step 5: Choose Search to see how many articles in the ProQuest database have those words.
Step 6: Post a screenshot of your search results (topic and the number of articles containing your search terms) to the top of a Word document [see Step 5 above]. Below the screenshot, answer the following questions:
On your search:
A. What terms did you use?
B. What other things did you mark on the search page before conducting your search?
C.Why did you choose the key words that you did?
D. How many articles were found with these search terms [from screenshot]?
Part 2:
Step 1: For our second more narrow search, go back and search using THE ENTIRE TITLE of the article you used the key words from in your first search. Paste the ENTIRE title into the search bar and find the full article [Do NOT checkmark anything to narrow your search this time!].
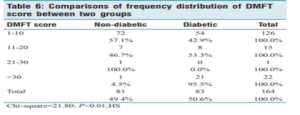
Step 2: Find a frequency table and/or graph within the article and post a screen shot in your Word document.
Example:
Frequency Distribution OR Graph
Step 3: Answer the following questions about your table and/or graph:
A. What type of study is used in the article (quantitative or qualitative)?
B. What type of graph or table did you choose for your lab? What characteristics make it this type?
C. Describe the data displayed in your frequency distribution or graph (consider class size, class width, total frequency, list of frequencies, class consistency, etc)
D. Draw a conclusion about the data from the graph or frequency distribution you chose.
E. How else might this data have been displayed? Discuss pros and cons of 2 other presentation options, such as tables or different graphical displays.
F. Give the full APA reference of the article you are using for this lab.
Step 5: Be sure your name is on the Word document, save it, and then submit it under “Assignments” and “Week 3: Lab”.
Solution
Within the very first investigation, I used the terms “diabetic patients” and also inspected 3 additional sections – “full text,” “peer reviewed,” and posted in the “last twelve months.” I chose the post since it’s among the additional 6 articles which I must choose based on the directions provided because of this job. The very first survey created 2,613 articles classified by relevance.
Swathi, M., Ramesh, T., Reddy, R. S., Begum, M. Reshmi, N., Rajesh, and R., T. (2018). Dental symptoms in diabetics undergoing treatment for ischemic heart disease:………………….please follow the link below to purchase the solution at $10
