Q1
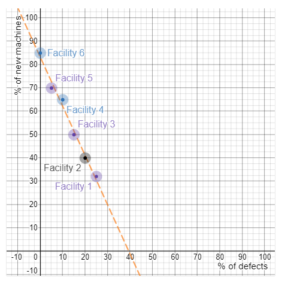
A shoe designer explored the relationship between the percent of defects and the percent of new machines at various production facilities throughout the state. The designer collects information from 6 of their facilities, shown in the table below.
Use the graph below to plot the points and develop a linear relationship between the percent of defects and the percent of new machines.
| Facility Number | % of Defects | % of New Machines |
| 1 | 25 | 32 |
| 2 | 20 | 40 |
| 3 | 15 | 50 |
| 4 | 10 | 65 |
| 5 | 5 | 70 |
| 6 | 0 | 85 |
Q2
Using the linear relationship graphed above, estimate the percent of new machines if there is 12% defects in the shoes at various production facilities.
Q3
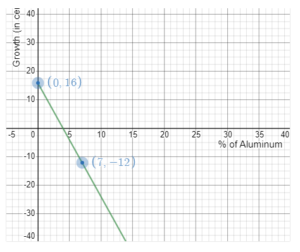
George is an avid plant lover and is concerned about the lack of daffodils that grow in his backyard. He finds the growth of the daffodils, G, is dependent on the percent of aluminum measured in the soil, x, and can be modeled by the function
G(x)=16−4x.
Draw the graph of the growth function by plotting its G-intercept and another point.
Q4
What percent of aluminum in the soil must there be for the daffodils to grow only by 5 centimeters?
- Round your final answer to the nearest whole number.
Q5
A runner finds that the distance they run in miles, D, is dependent on the ounces of water consumed every two hours, x, and can be modeled by the function
D(x)=1.5x.
Draw the graph of the distance function by plotting its D-intercept and another point.
Q6
How much water should be consumed every two hours for a person to run 16 miles?
- Round your final answer to the nearest whole number.
Q7
A gym teacher finds that the distance students run in miles per week in gym class, D, is dependent on the time students warm-up beforehand in minutes per week, x, and can be modeled by the function
D(x)=2+0.5x.
Draw the graph of the distance function by plotting its D-intercept and another point.
Q8
How long did a student warm-up in order for them to run 10 miles per week in gym class?
Q9
A department store manager explored the relationship between the percent of customers that wait more than 7 minutes in line and the percent of customers that purchase last minute items at checkout. The manager collects information from 5 checkout lines, shown in the table below.
Use the graph below to plot the points and develop a linear relationship between the percent of waiting customers and the percent of last minute purchases.
| Line | % of Waiting Customers | % of Last Minute Purchases |
| 1 | 25 | 3 |
| 2 | 35 | 11 |
| 3 | 50 | 16 |
| 4 | 60 | 20 |
| 5 | 70 | 30 |
Q10
Using the linear relationship graphed above, estimate the percent of last minute purchases if 40% of the customers wait more than 7 minutes in line.
Solution
Q1
A shoe designer explored the relationship between the percent of defects and the percent of new machines at various production facilities throughout the state. The designer collects information from 6 of their facilities, shown in the table below.
Use the graph below to plot the points and develop a linear relationship between the percent of defects and the percent of new machines.
| Facility Number | % of Defects | % of New Machines |
| 1 | 25 | 32 |
| 2 | 20 | 40 |
| 3 | 15 | 50 |
| 4 | 10 | 65 |
| 5 | 5 | 70 |
| 6 | 0 | 85 |
Ans:
Q2
Using the linear relationship graphed above, estimate the percent of new machines if there is 12% defects in the shoes at various production facilities.
Ans: 58%
Q3
George is an avid plant lover and is concerned about the lack of daffodils that grow in his backyard. He finds the growth of the daffodils, G, is dependent on the percent of aluminum measured in the soil, x, and can be modeled by the function
G(x)=16−4x.
Draw the graph of the growth function by plotting its G-intercept and another point.
Ans:
 ………..please follow the link below to purchase all the solutions at $5
