Q1
Data is collected on the relationship between time spent playing video games and time spent with family. The data is shown in the table and the line of best fit for the data is yˆ=−0.287x+76.6. Assume the line of best fit is significant and there is a strong linear relationship between the variables.
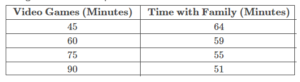
(a) According to the line of best fit, what would be the predicted number of minutes spent with family for someone who spent 120 minutes playing video games? Round your answer to two decimal places.
Q2
Data is collected on the relationship between time spent playing video games and time spent with family. The data is shown in the table and the line of best fit for the data is yˆ=−0.287x+76.6.
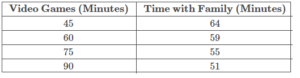
(a) According to the line of best fit, the predicted number of minutes spent with family for someone who spent 120 minutes playing video games is 42.16.
(b) Is it reasonable to use this line of best fit to make the above prediction?
Ans:
The estimate, a predicted time of 42.16 minutes, is reliable and reasonable.
The estimate, a predicted time of 42.16 minutes, is unreliable and unreasonable.
The estimate, a predicted time of 42.16 minutes, is reliable but unreasonable.
The estimate, a predicted time of 42.16 minutes, is unreliable but reasonable.
Q3
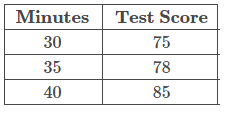
Janet is studying the relationship between the average number of minutes spent exercising per day and math test scores and has collected the data shown in the table. The line of best fit for the data is yˆ=0.46x+66.4. Assume the line of best fit is significant and there is a strong linear relationship between the variables.
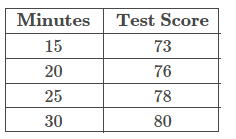
(a) According to the line of best fit, what would be the predicted test score for someone who spent 23 minutes exercising? Round your answer to two decimal places.
Q4
Janet is studying the relationship between the average number of minutes spent exercising per day and math test scores and has collected the data shown in the table. The line of best fit for the data is yˆ=0.46x+66.4.
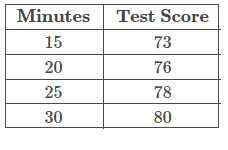
(a) According to the line of best fit, the predicted test score for someone who spent 23 minutes exercising is 76.98.
(b) Is it reasonable to use this line of best fit to make the above prediction?
Ans:
The estimate, a predicted test score of 76.98, is reliable and reasonable.
The estimate, a predicted test score of 76.98, is unreliable but reasonable.
The estimate, a predicted test score of 76.98, is unreliable and unreasonable.
The estimate, a predicted test score of 76.98, is reliable but unreasonable.
Q5
Erin is studying the relationship between the average number of minutes spent reading per day and math test scores and has collected the data shown in the table. The line of best fit for the data is yˆ=0.8x+51.2. According to the line of best fit, what would be the predicted test score for someone who spent 70 minutes reading? Is it reasonable to use this line of best fit to make this prediction?
Ans:
The predicted test score is 95.2, and the estimate is not reasonable.
The predicted test score is 95.2, and the estimate is reasonable.
The predicted test score is 107.2, and the estimate is not reasonable.
The predicted test score is 107.2, and the estimate is reasonable.
Q7
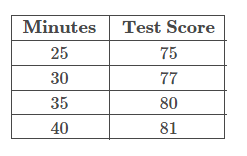
Data is collected on the relationship between the average number of minutes spent exercising per day and math test scores. The data is shown in the table and the line of best fit for the data is yˆ=0.42x+64.6. Assume the line of best fit is significant and there is a strong linear relationship between the variables.
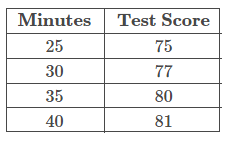
(a) According to the line of best fit, what would be the predicted test score for someone who spent 38 minutes exercising? Round your answer to two decimal places.
Q8
Data is collected on the relationship between the average number of minutes spent exercising per day and math test scores. The data is shown in the table and the line of best fit for the data is yˆ=0.42x+64.6.
(a) According to the line of best fit, the predicted test score for someone who spent 38 minutes exercising is 80.56.
(b) Is it reasonable to use this line of best fit to make the above prediction?
Ans:
The estimate, a predicted test score of 80.56, is both reliable and reasonable.
The estimate, a predicted test score of 80.56, is reliable but unreasonable.
The estimate, a predicted test score of 80.56, is both unreliable and unreasonable.
The estimate, a predicted test score of 80.56, is unreliable but reasonable.
Q9
A park ranger is interested in plant growth around the trails of the park. He finds the plants growth, G, is dependent on the number of sunny days that occur in three months, x, and can be modeled by the function
G(x)=−8+3x.
Draw the graph of the growth function by plotting its G-intercept and another point.
Q10
How many sunny days must there be for the plants to grow 35 centimeters?
- Round your final answer to the nearest whole number.
Q11
Using a calculator or statistical software, find the linear regression line for the data in the table below.
Enter your answer in the form y=mx+b, with m and b both rounded to two decimal places.
| x | y |
| 0 | 2.83 |
| 1 | 3.33 |
| 2 | 6.99 |
| 3 | 8.01 |
| 4 | 7.62 |
| 5 | 7.66 |
Q12
Find the linear regression line for the following table of values. You will need to use a calculator, spreadsheet, or statistical software.
Enter your answer in the form y=mx+b, with m and b both rounded to two decimal places.
| x | y |
| 0 | 2.21 |
| 1 | 3.44 |
| 2 | 2.71 |
| 3 | 4.97 |
| 4 | 7.56 |
| 5 | 5.88 |
| 6 | 6.62 |
Q13
A least squares regression line (best-fit line) has the equation, yˆ=2.87x−43.5. What is the slope of this linear regression equation?
Ans:
The slope of the line is 2.87, which tells us that the dependent variable (y) decreases 2.87 for every one unit increase in the independent (x) variable, on average.
The slope of the line is 2.87, which tells us that the dependent variable (y) increases 2.87 for every one unit increase in the independent (x) variable, on average.
The slope of the line is −43.5, which tells us that the dependent variable (y) increases 43.5 for every one unit increase in the independent (x) variable, on average.
The slope of the line is −43.5, which tells us that the dependent variable (y) decreases 43.5 for every one unit increase in the independent (x) variable, on average.
Q14
Researchers want to find the relationship between age and average weight in female children. Using a calculator or statistical software, find the linear regression line for the 2012 CDC data below for average weights of female children by age.
| age (years) | weight (lbs) |
| 1 | 24.1 |
| 2 | 29.5 |
| 3 | 34.5 |
| 4 | 39.1 |
| 5 | 46.6 |
| 6 | 51.9 |
| 7 | 59.1 |
Ans:
y=5.78x+17.56
y=1.0x+15.69
y=−5.78x+14.32
y=1.0x+15.55
Solution
Q1
Data is collected on the relationship between time spent playing video games and time spent with family. The data is shown in the table and the line of best fit for the data is yˆ=−0.287x+76.6. Assume the line of best fit is significant and there is a strong linear relationship between the variables.
(a) According to the line of best fit, what would be the predicted number of minutes spent with family for someone who spent 120 minutes playing video games? Round your answer to two decimal places.
Ans: The predicted number of minutes spent with family is 1.
Correct answers:
- 1 42.16
Q2
Data is collected on the relationship between time spent playing video games and time spent with family. The data is shown in the table and the line of best fit for the data is yˆ=−0.287x+76.6.
(a) According to the line of best fit, the predicted number of minutes spent with family for someone who spent 120 minutes playing video games is 42.16.
(b) Is it reasonable to use this line of best fit to make the above prediction?
Ans:
The estimate, a predicted time of 42.16 minutes, is reliable and reasonable.
The estimate, a predicted time of 42.16 minutes, is unreliable and unreasonable.
The estimate, a predicted time of 42.16 minutes, is reliable but unreasonable.
The estimate, a predicted time of 42.16 minutes, is unreliable but reasonable.
Q3
Janet is studying the relationship between the average number of minutes spent exercising per day and math test scores and has collected the data shown in the table. The line of best fit for the data is yˆ=0.46x+66.4. Assume the line of best fit is significant and there is a strong linear relationship between the variables.
(a) According to the line of best fit, what would be the predicted test score for someone who spent 23 minutes exercising? Round your answer to two decimal places.
Ans:
The predicted test score is 1
Correct answers:
1 76.98……….please follow the link below to purchase all the solutions at $10
