Question
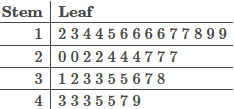
A set of data is summarized by the stem and leaf plot below.
Question
A set of data is summarized by the stem and leaf plot below.
Question
In the scenario above, what is the least number of textbooks brought home per student on a Friday?
Question
A college student records the number of textbooks that are brought home on a Friday from a random sample of 20 history majors. Below is the data.
| 8 | 7 | 3 | 4 |
| 7 | 1 | 2 | 2 |
| 7 | 3 | 4 | 8 |
| 5 | 5 | 2 | 3 |
| 6 | 7 | 8 | 4 |
Make a dot plot which represents the textbook data.
Question
A mathematics professor created a test that was supposed to be mostly easy except for two challenging problems. The scores of the students are shown in the dot plot below. What is the range of the scores? Do not include the percent sign in your answer.
A dot plot has a horizontal axis labeled Test Score Percentage from 70 to 100 in increments of 5. Columns of dots are plotted over horizontal coordinates with heights as follows, where the horizontal coordinate is listed first and the number of dots in the column is listed second: 70, 1; 71, 1; 74, 1; 75, 2; 76, 2; 77, 3; 78, 2; 79, 4; 80, 5; 81, 5; 82, 6; 83, 7; 84, 7; 85, 9; 86, 11; 87, 13; 88, 14; 89, 15; 90, 14; 91, 13; 92, 2; 93, 2.
Question
Describe the shape of the given dot plot.
Question
A set of data is summarized by the stem and leaf plot below.
Question
A set of data is summarized by the stem and leaf plot below.
Solution
Question
A set of data is summarized by the stem and leaf plot below.
Answer:
Answer: There are
Remember that every entry in the leaf column corresponds to a value in the data set. To see…………….please follow the link below to purchase the solution at $4
