Q1
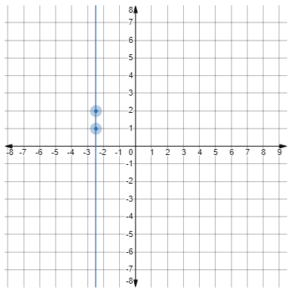
Graph the equation x=−52 by plotting points.
Ans:
Q2
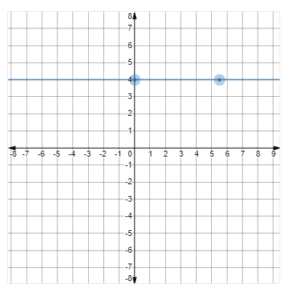
Graph the equation y=4 by plotting points.
Ans:
Q3
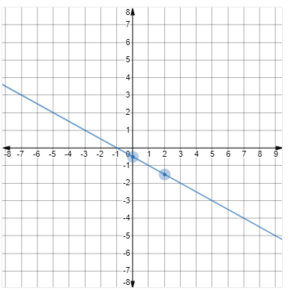
Graph the equation −x−2y=1 by plotting points.
Ans:
Q4
The graph of y=−x/2−2 is shown below.
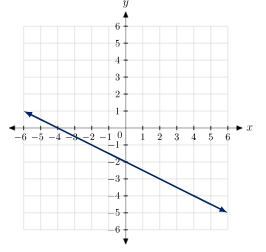
Use the graph to determine which of the ordered pairs is a solution to the equation. Select all that apply.
Ans:
(−4,0)
(0,−2)
(2,−3)
(−1,72)
(0,−4)
Q5
The graph of y=−x−3 is shown below.
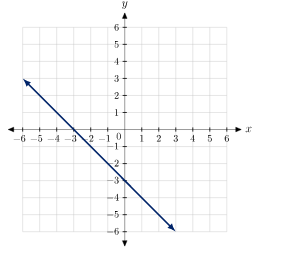
Use the graph to determine which of the ordered pairs is a solution to the equation.
Ans:
(−3,−2)
(1,−4)
(−3,−4)
(−3,0)
(0, 0)
Q6
Graph the equation y=−4x−3 by plotting points with the line tool.
Ans:
Q7
Graph the equation y=4x−1 by plotting points with the line tool.
Ans:
Q8
Graph the equation −x+y=−9 by plotting points.
Ans:
Q9
Graph the equation y=−2x−3 by plotting points with the line tool.
Ans:
Q10
Graph the equation y=−4x−2 by plotting points with the line tool.
Ans:
Q11
Graph the equation −2x+3y=−3 by plotting points.
Ans:
Q12
Graph the equation −x+4y=6 by plotting points.
Ans:
Q13
The graph of y=−x/3−1 is shown below.
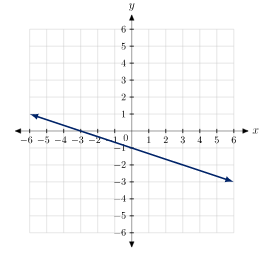
Use the graph to determine which of the ordered pairs is a solution to the equation.
Ans:
(0,−1)
(3,−2)
(3,−5)
(0,−5)
(−3,0)
Q14
The graph of y=−x−2 is shown below.
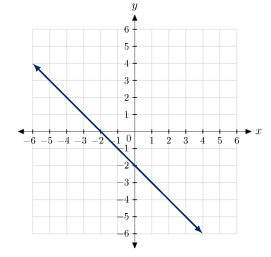
Use the graph to determine which of the ordered pairs is a solution to the equation.
Ans:
(1,−3)
(−2,0)
(4,−1)
(0,2)
(0,−2)
Q15
Graph the equation y=−7/2 by plotting points.
Ans:
Q16
Graph the equation x=32 by plotting points.
Ans:
Solution
Q1
Graph the equation x=−52 by plotting points.
Ans:
Q2
Graph the equation y=4 by plotting points.
Ans:
Q3
Graph the equation −x−2y=1 by plotting points.
Ans:
 ……………please follow the link below to purchase all the solutions at$10
