Question 1
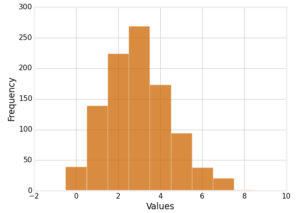
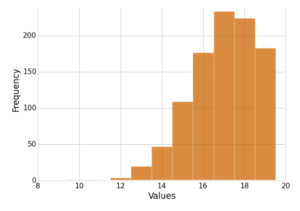
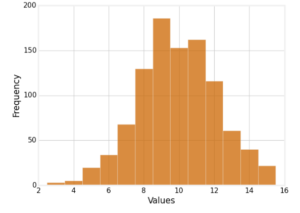
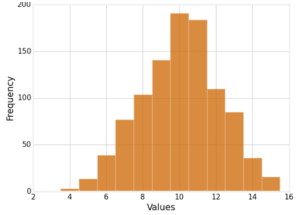
Which of the following histograms shows a skewed data set?
Question 2
Given the following box-and-whisker plot, decide if the data is skewed or symmetrical.
Ans:
The data are skewed to the left.
The data are skewed to the right.
The data are symmetric.
Question 3
Given the following frequency table, decide if the data is skewed or symmetrical.
| Value | Frequency |
| 4 | 1 |
| 5 | 10 |
| 6 | 8 |
| 7 | 28 |
| 8 | 50 |
| 9 | 69 |
| 10 | 72 |
| 11 | 62 |
| 12 | 52 |
| 13 | 23 |
| 14 | 16 |
| 15 | 6 |
| 16 | 3 |
Ans:
The data are skewed to the left.
The data are skewed to the right.
The data are symmetric.
Question 4
Which of the following frequency tables show a skewed data set? Select all answers that apply.
| Value | Frequency |
| 0 | 2 |
| 1 | 11 |
| 2 | 30 |
| 3 | 22 |
| 4 | 15 |
| 5 | 12 |
| 6 | 6 |
| 7 | 1 |
| 8 | 1 |
| Value | Frequency |
| 4 | 1 |
| 5 | 2 |
| 6 | 3 |
| 7 | 7 |
| 8 | 19 |
| 9 | 17 |
| 10 | 17 |
| 11 | 15 |
| 12 | 12 |
| 13 | 4 |
| 14 | 1 |
| 15 | 2 |
| Value | Frequency |
| 13 | 1 |
| 14 | 6 |
| 15 | 9 |
| 16 | 15 |
| 17 | 27 |
| 18 | 28 |
| 19 | 10 |
| 20 | 4 |
| Value | Frequency |
| 3 | 1 |
| 4 | 0 |
| 5 | 1 |
| 6 | 5 |
| 7 | 9 |
| 8 | 12 |
| 9 | 12 |
| 10 | 18 |
| 11 | 12 |
| 12 | 17 |
| 13 | 11 |
| 14 | 0 |
| 15 | 1 |
| 16 | 0 |
| 17 | 1 |
…………..please follow the link below to purchase the solution at $5
