Q1
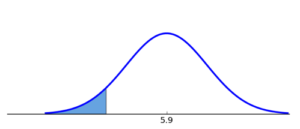
Which graph below corresponds to the following hypothesis test?
H0:μ≥5.9, Ha:μ<5.9
Ans:
Q2
Which of the hypothesis tests listed below is a left-tailed test? Select all correct answers.
Ans:
H0:μ≥18, Ha:μ<18
H0:μ≤19.3, Ha:μ>19.3
H0:μ=8, Ha:μ≠8
H0:μ≥11.3, Ha:μ<11.3
H0:μ≥3.7, Ha:μ<3.7
Q3
Suppose a chef claims that her meatball weight is less than 3 ounces, on average. Several of her customers do not believe her, so the chef decides to do a hypothesis test, at a 1% significance level, to persuade them. She cooks 25 meatballs. The mean weight of the sample meatballs is 2 ounces. The chef knows from experience that the standard deviation for her meatball weight is 0.5 ounces.
- H0: μ≥3; Ha: μ<3
- α=0.01(significance level)
What is the test statistic (z-score) of this one-mean hypothesis test, rounded to two decimal places?
Q4
Jamie, a bowler, claims that her bowling score is less than 168 points, on average. Several of her teammates do not believe her, so she decides to do a hypothesis test, at a 1% significance level, to persuade them. She bowls 17 games. The mean score of the sample games is 155 points. Jamie knows from experience that the standard deviation for her bowling score is 19 points.
- H0: μ≥168; Ha: μ<168
- α=0.01 (significance level)
What is the test statistic (z-score) of this one-mean hypothesis test, rounded to two decimal places?
Q5
Determine the Type I error if the null hypothesis, H0, is: the percentage of homes in the city that are not up to the current electric codes is no more than 10%.
And, the alternative hypothesis, Ha, is: the percentage of homes in the city that are not up to the current electric codes is more than 10%.
Ans:
There is insufficient evidence to conclude that more than 10% of homes in the city are not up to the current electrical codes when, in fact, there are more than 10% that are not up to the current electric codes.
There is insufficient evidence to conclude that less than 10% of homes in the city are not up to the current electrical codes when, in fact, there are less than 10% that are not up to the current electric codes.
There is sufficient evidence to conclude that more than 10% of homes in the city are not up to the current electrical codes when, in fact, there are no more than 10% that are not up to the current electric codes.
There is sufficient evidence to conclude that less than 10% of homes in the city are not up to the current electrical codes when, in fact, there are at least 10% that are not up to the current electric codes.
Q6
Which of the following results in a null hypothesis p≤0.69 and alternative hypothesis p>0.69?
Ans:
A mechanic wants to show that the percentage of car owners that follow a normal maintenance schedule is not 69%, contrary to a study that found that the percentage was 69%.
A mechanic wants to show that more than 69% of car owners follow a normal maintenance schedule, contrary to a study that found that the percentage was at most 69%.
A mechanic wants to show that at most 69% of car owners follow a normal maintenance schedule, contrary to a study that found that the percentage was more than 69%.
A mechanic wants to show that less than 69% of car owners follow a normal maintenance schedule, contrary to a study that found that the percentage was at least 69%.
Q7
Suppose the null hypothesis, H0, is: a sporting goods store claims that at least 70% of its customers do not shop at any other sporting goods stores. What is the Type I error in this scenario?
Ans:
The sporting goods store thinks that less than 70% of its customers do not shop at any other sporting goods stores when, in fact, less than 70% of its customers do not shop at any other sporting goods stores.
The sporting goods store thinks that at least 70% of its customers do not shop at any other sporting goods stores when, in fact, at least 70% of its customers do not shop at any other sporting goods stores.
The sporting goods store thinks that less than 70% of its customers do not shop at any other sporting goods stores when, in fact, at least 70% of its customers do not shop at any other sporting goods stores.
The sporting goods store thinks that at least 70% of its customers do not shop at any other sporting goods stores when, in fact, less than 70% of its customers do not shop at any other sporting goods stores.
Q8
Which of the following results in a null hypothesis p≥0.44 and alternative hypothesis p<0.44?
Ans:
An online article is trying to show that less than 44% of internet users participate in social media, contrary to an established figure saying that at least 44% of internet users participate in social media.
An online article is trying to show that 44% of internet users participate in social media, contrary to an established figure saying that more than 44% of internet users participate in social media.
An online article is trying to show that more than 44% of internet users participate in social media, contrary to an established figure saying that at most 44% of internet users participate in social media.
An online article is trying to show that at least 44% of internet users participate in social media, contrary to an established figure saying that less than 44% of internet users participate in social media.
Q9
Identify the type of hypothesis test below.
H0:X≥17.9, Ha:X<17.9
Ans:
The hypothesis test is two-tailed.
The hypothesis test is left-tailed.
The hypothesis test is right-tailed.
Q10
Identify the type of hypothesis test below.
H0:X≤16.9, Ha:X>16.9
Ans:
The hypothesis test is two-tailed.
The hypothesis test is left-tailed.
The hypothesis test is right-tailed.
Q11
A mechanic wants to show that more than 44% of car owners do not follow a normal maintenance schedule. Identify the null hypothesis, H0, and the alternative hypothesis, Ha, in terms of the parameter p.
Ans:
H0: p≤0.44; Ha: p>0.44
H0: p<0.44; Ha: p≥0.44
H0: p>0.44; Ha: p≤0.44
H0: p≥0.44; Ha: p<0.44
Q12
Which of the following results in a null hypothesis μ≤7 and alternative hypothesis μ>7?
Ans:
A study wants to show that the mean number of hours of sleep the average person gets each day is at least 7.
A study wants to show that the mean number of hours of sleep the average person gets each day is 7.
A study wants to show that the mean number of hours of sleep the average person gets each day is more than 7.
A study wants to show that the mean number of hours of sleep the average person gets each day is at most 7.
Q13
Determine the Type I error if the null hypothesis, H0, is: researchers claim that 65% of college students will graduate with debt.
Ans:
The researchers think that greater than or less than 65% of college students will graduate with debt when, in fact, 65% will graduate with debt.
The researchers think that 65% of college students will graduate with debt when, in fact, more or less than 65% of college students will graduate with debt.
The researchers think that 65% of college students will graduate with debt when, in fact, 65% of college students really will graduate with debt.
The researchers think that greater than or less than 65% of college students will graduate with debt when, in fact, greater than or less than 65% of college students will graduate with debt.
Q14
Determine the Type II error if the null hypothesis, H0, is: researchers claim that 65% of college students will graduate with debt.
Ans:
The researchers think that greater than or less than 65% of college students will graduate with debt when, in fact, 65% will graduate with debt.
The researchers think that 65% of college students will graduate with debt when, in fact, more or less than 65% of college students will graduate with debt.
The researchers think that 65% of college students will graduate with debt when, in fact, 65% of college students really will graduate with debt.
The researchers think that greater than or less than 65% of college students will graduate with debt when, in fact, greater than or less than 65% of college students
Q15
Jolyn, a golfer, claims that her drive distance is not equal to 222 meters, on average. Several of her friends do not believe her, so she decides to do a hypothesis test, at a 5% significance level, to persuade them. She hits 11 drives. The mean distance of the sample drives is 218 meters. Jolyn knows from experience that the standard deviation for her drive distance is 14 meters.
- H0: μ=222; Ha: μ≠222
- α=0.05 (significance level)
What is the test statistic (z-score) of this one-mean hypothesis test, rounded to two decimal places?
Q16
Suppose a chef claims that her meatball weight is not equal to 4 ounces, on average. Several of her customers do not believe her, so the chef decides to do a hypothesis test, at a 10% significance level, to persuade them. She cooks 13 meatballs. The mean weight of the sample meatballs is 3.9 ounces. The chef knows from experience that the standard deviation for her meatball weight is 0.6 ounces.
- H0: μ=4; Ha: μ≠4
- α=0.1 (significance level)
What is the test statistic (z-score) of this one-mean hypothesis test, rounded to two decimal places?
Q17
Suppose a bowler claims that her bowling score is more than 157 points, on average. Several of her teammates do not believe her, so the bowler decides to do a hypothesis test, at a 10% significance level, to persuade them. She bowls 23 games. The mean score of the sample games is 170 points. The bowler knows from experience that the standard deviation for her bowling score is 11 points.
- H0: μ≤157; Ha: μ>157
- α=0.1 (significance level)
What is the test statistic (z-score) of this one-mean hypothesis test?
Ans:
Q18
Lexie, a chef, claims that her meatball weight is more than 3 ounces, on average. Several of her customers do not believe her, so she decides to do a hypothesis test, at a 1% significance level, to persuade them. She cooks 12 meatballs. The mean weight of the sample meatballs is 3.6 ounces. Lexie knows from experience that the standard deviation for her meatball weight is 0.5 ounces.
- H0: μ≤3; Ha: μ>3
- α=0.01 (significance level)
What is the test statistic (z-score) of this one-mean hypothesis test, rounded to two decimal places?
Q19
Lexie, a bowler, claims that her bowling score is more than 140 points, on average. Several of her teammates do not believe her, so she decides to do a hypothesis test, at a 5% significance level, to persuade them. She bowls 18 games. The mean score of the sample games is 155 points. Lexie knows from experience that the standard deviation for her bowling score is 17 points.
- H0: μ≤140; Ha: μ>140
- α=0.05 (significance level)
What is the test statistic (z-score) of this one-mean hypothesis test, rounded to two decimal places?
Q20
Gail, a baker, claims that her bread height is not equal to 14 cm, on average. Several of her customers do not believe her, so she decides to do a hypothesis test, at a 5% significance level, to persuade them. She bakes 15 loaves of bread. The mean height of the sample loaves is 13.8 cm. Gail knows from experience that the standard deviation for her bread height is 0.7 cm.
- H0: μ=14; Ha: μ≠14
- α=0.05 (significance level)
What is the test statistic (z-score) of this one-mean hypothesis test, rounded to two decimal places?
Q21
Q22
Q23
Two basketball players, Jerry and Henry, want to find out who has the greater height when compared to each of their teams. Jerry has a height of 72.5 inches, and his team has a mean height of 75.5 inches and a standard deviation of 2 inches. Henry has a height of 73 inches, and his team has a mean of 75 inches and a standard deviation of 2.5 inches. Who has the greater height when compared to each of their teams?
Ans:
Jerry
Henry
The heights are equal when compared to each of their teams.
There is not enough information.
Q24
Two sprinters, Nick and Ryan, want to find out who has the faster time when compared to each of their teams. Nick has a time of 10.8 seconds, and his team has a mean time of 11.4 seconds and a standard deviation of 0.4 seconds. Ryan has a time of 11.2 seconds, and his team has a mean of 11.5 seconds and a standard deviation of 0.1 seconds. Who has the faster time when compared to each of their teams?
Ans:
Nick
Ryan
The times are equal when compared to each of their teams.
There is not enough information.
Q25
Floretta, a pitcher, claims that her pitch speed is less than 46 miles per hour, on average. Several of her teammates do not believe her, so she decides to do a hypothesis test, at a 5% significance level, to persuade them. She throws 24 pitches. The mean speed of the sample pitches is 37 miles per hour. Floretta knows from experience that the standard deviation for her pitch speed is 5 miles per hour.
- H0: μ≥46; Ha: μ<46
- α=0.05 (significance level)
What is the test statistic (z-score) of this one-mean hypothesis test, rounded to two decimal places?
Q26
Olivia, a long jumper, claims that her jump distance is more than 18 feet, on average. Several of her teammates do not believe her, so she decides to do a hypothesis test, at a 1% significance level, to persuade them. She makes 23 jumps. The mean distance of the sample jumps is 20 feet. Olivia knows from experience that the standard deviation for her jump distance is 1.1 feet.
- H0: μ≤18; Ha: μ>18
- α=0.01 (significance level)
What is the test statistic (z-score) of this one-mean hypothesis test, rounded to two decimal places?
Q27
Rosetta, a pitcher, claims that her pitch speed is not equal to 59 miles per hour, on average. Several of her teammates do not believe her, so she decides to do a hypothesis test, at a 1% significance level, to persuade them. She throws 14 pitches. The mean speed of the sample pitches is 58 miles per hour. Rosetta knows from experience that the standard deviation for her pitch speed is 6 miles per hour.
- H0: μ=59; Ha: μ≠59
- α=0.01(significance level)
What is the test statistic (z-score) of this one-mean hypothesis test, rounded to two decimal places?
Solution
Q1
Which graph below corresponds to the following hypothesis test?
H0:μ≥5.9, Ha:μ<5.9
Ans: A
Q2
Which of the hypothesis tests listed below is a left-tailed test? Select all correct answers.
Ans:
H0:μ≥18, Ha:μ<18
H0:μ≤19.3, Ha:μ>19.3
H0:μ=8, Ha:μ≠8
H0:μ≥11.3, Ha:μ<11.3
H0:μ≥3.7, Ha:μ<3.7
Q3
Suppose a chef claims that her meatball weight is less than 3 ounces, on average. Several of her customers do not believe her, so the chef decides to do a hypothesis test, at a 1% significance level, to persuade them. She cooks 25 meatballs. The mean weight of the sample meatballs is 2 ounces. The chef knows from experience that the standard deviation for her meatball weight is 0.5 ounces.
- H0: μ≥3; Ha: μ<3
- α=0.01(significance level)
What is the test statistic (z-score) of this one-mean hypothesis test, rounded to two decimal places?
Ans: Test statistic = -10……………..please follow the link below to unlock the other solutions at just $10
