Week 5 Assignment: Probability Using the Normal Distribution
Question
As stated in the previous problem, in a small town, 50% of single family homes have a front porch. 48 single family houses are randomly selected. If X represents the number of single family homes with a porch, then the distribution of X can be approximated with a normal distribution, N(24,3.5), where the mean (μ) is 24 and standard deviation (σ) is 3.5.
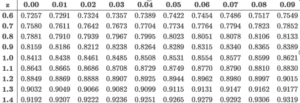
Using this approximation, find the probability that 27 or 28 single family homes will have a porch. You may use the portion of the Standard Normal Table below.
- Round the final answer to two decimal places.
Question
In a small town, 50% of single family homes have a front porch. 48 single family homes are randomly selected. Let X represent the number of single family homes with a porch. What normal distribution best approximates X?
- Round to one decimal place if entering a decimal answer below.
Question
Determine the area under the standard normal curve that lies to the right of the z-score −0.97 and to the left of the z-score −0.59.
Use the value(s) from the table above.
Question
Determine the area under the standard normal curve that lies to the right of the z-score of 1.73.
Use the value(s) from the table above.
Question
The times to complete an obstacle course is normally distributed with mean 73 seconds and standard deviation 9 seconds. What is the probability using the Empirical Rule that a randomly selected finishing time is less than 100 seconds?
- Provide the final answer as a percent rounded to two decimal places.
Question
After collecting the data, Christopher finds that the total snowfall per year in Reamstown is normally distributed with mean 94 inches and standard deviation 14 inches. What is the probability that, in a randomly selected year, the snowfall was greater than 52 inches? Use the empirical rule.
- Provide the final answer as a percent rounded to two decimal places.
Question
Find the area to the right of the z-score 1.39 and to the left of the z-score 1.53 under the standard normal curve.
Use the value(s) from the table above.
Question
Find the area to the right of the z-score −1.90 under the standard normal curve.
Use the value(s) from the table above.
Question
Nick has collected data to find that the body weights of the forty students in a class has a normal distribution. What is the probability that a randomly selected student has a body weight of greater than 169 pounds if the mean is 142 pounds and the standard deviation is 9 pounds? Use the empirical rule.
- Provide the final answer as a percent rounded to two decimal places.
Question
Henry has collected data to find that the typing speeds for the students in a typing class has a normal distribution. What is the probability that a randomly selected student has a typing speed of less than 51 words per minute if the mean is 47 words per minute and the standard deviation is 4 words per minute? Use the empirical rule.
- Provide the final answer as a percent.
Question
As in the previous problem, a fair coin is flipped 28 times. If X is the number of heads, then the distribution of X can be approximated with a normal distribution, N(14,2.6), where the mean (μ) is 14 and standard deviation (σ) is 2.6.
Using this approximation, find the probability of flipping 18 or 19 heads. You may use the portion of the Standard Normal Table below.
Round the final answer to two decimal places.
Question
A fair coin is flipped 28 times. Let X be the number of heads. What normal distribution best approximates X?
- Round to one decimal place if entering a decimal answer below.
Solution
Question
As stated in the previous problem, in a small town, 50% of single family homes have a front porch. 48 single family houses are randomly selected. If X represents the number of single family homes with a porch, then the distribution of X can be approximated with a normal distribution, N(24,3.5), where the mean (μ) is 24 and standard deviation (σ) is 3.5.
Using this approximation, find the probability that 27 or 28 single family homes will have a porch. You may use the portion of the Standard Normal Table below.
- Round the final answer to two decimal places.
Ans: 0.14
Question
In a small town, 50% of single family homes have a front porch. 48 single family homes are randomly selected. Let X represent the number of single family homes with a porch. What normal distribution best approximates X?
- Round to one decimal place if entering a decimal answer below.
Ans: N(24,……………..please follow the link below to purchase the solution at $5
